
BD PharmingenTM Biotin Hamster Anti-Mouse gammadelta T-Cell Receptor
553176 ·
BDB Bioscience · Cat: 553176
Reach 3+ verified distributors
Manufacturer product page
bdbiosciences.com/en-us/products/reagents/flow-cytometry-rea...Description
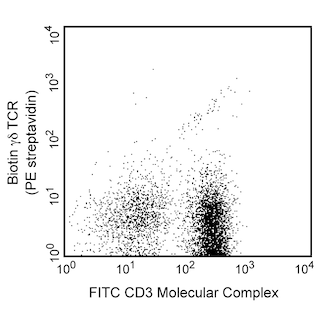
Two-color analysis of the expression of gammadelta TCR on peripheral T lymphocytes. C57BL/6 lymph node cells were incubated simultaneously with Biotin Hamster Anti-Mouse gammadelta T-Cell Receptor Cat. No. 553176, right panel and FITC Rat Anti-Mouse CD3 Molecular Complex Cat. No. 555274 , followed by PE Streptavidin Cat. No. 554061 . Fluorescence dot plots were derived from gated events based on the forward and side light-scattering of viable lymphocytes. Flow cytometry was performed on a BD FACScan. Two-color analysis of the expression of gammadelta TCR on peripheral T lymphocytes. C57BL/6 lymph node cells were incubated simultaneously with Biotin Hamster Anti-Mouse gammadelta T-Cell Receptor Cat. No. 553176, right panel and FITC Rat Anti-Mouse CD3 Molecular Complex Cat. No. 555274 , followed by PE Streptavidin Cat. No. 554061 . Fluorescence dot plots were derived from gated events based on the forward and side light-scattering of viable lymphocytes. Flow cytometry was performed on a BD FACScan. Two-color analysis of the expression of gammadelta TCR on peripheral T lymphocytes. C57BL/6 lymph node cells were incubated simultaneously with Biotin Hamster Anti-Mouse gammadelta T-Cell Receptor Cat. No. 553176, right panel and FITC Rat Anti-Mouse CD3 Molecular Complex Cat. No. 555274 , followed by PE Streptavidin Cat. No. 554061 . Fluorescence dot plots were derived from gated events based on the forward and side light-scattering of viable lymphocytes. Flow cytometry was performed on a BD FACScan. Show More Two-color analysis of the expression of gammadelta TCR on peripheral T lymphocytes. C57BL/6 lymph node cells were incubated simultaneously with Biotin Hamster Anti-Mouse gammadelta T-Cell Receptor Cat. No. 553176, right panel and FITC Rat Anti-Mouse CD3 Molecular Complex Cat. No. 555274 , followed by PE Streptavidin Cat. No. 554061 . Fluorescence dot plots were derived from gated events based on the forward and side light-scattering of viable lymphocytes. Flow cytometry was performed on a BD FACScan. Show More Two-color analysis of the expression of gammadelta TCR on peripheral T lymphocytes. C57BL/6 lymph node cells were incubated simultaneously with Biotin Hamster Anti-Mouse gammadelta T-Cell Receptor Cat. No. 553176, right panel and FITC Rat Anti-Mouse CD3 Molecular Complex Cat. No. 555274 , followed by PE Streptavidin Cat. No. 554061 . Fluorescence dot plots were derived from gated events based on the forward and side light-scattering of viable lymphocytes. Flow cytometry was performed on a BD FACScan. Two-color analysis of the expression of gammadelta TCR on peripheral T lymphocytes. C57BL/6 lymph node cells were incubated simultaneously with Biotin Hamster Anti-Mouse gammadelta T-Cell Receptor Cat. No. 553176, right panel and FITC Rat Anti-Mouse CD3 Molecular Complex Cat. No. 555274 , followed by PE Streptavidin Cat. No. 554061 . Fluorescence dot plots were derived from gated events based on the forward and side light-scattering of viable lymphocytes. Flow cytometry was performed on a BD FACScan.