
Human C1qR1 (Complement Component 1, Q Receptor) ELISA Kit
EH26434-96T · 96T
Verified Partner
Sign in to see pricing and request a quote.
Brand Store Product
No external links. Get your quote directly here.
Description
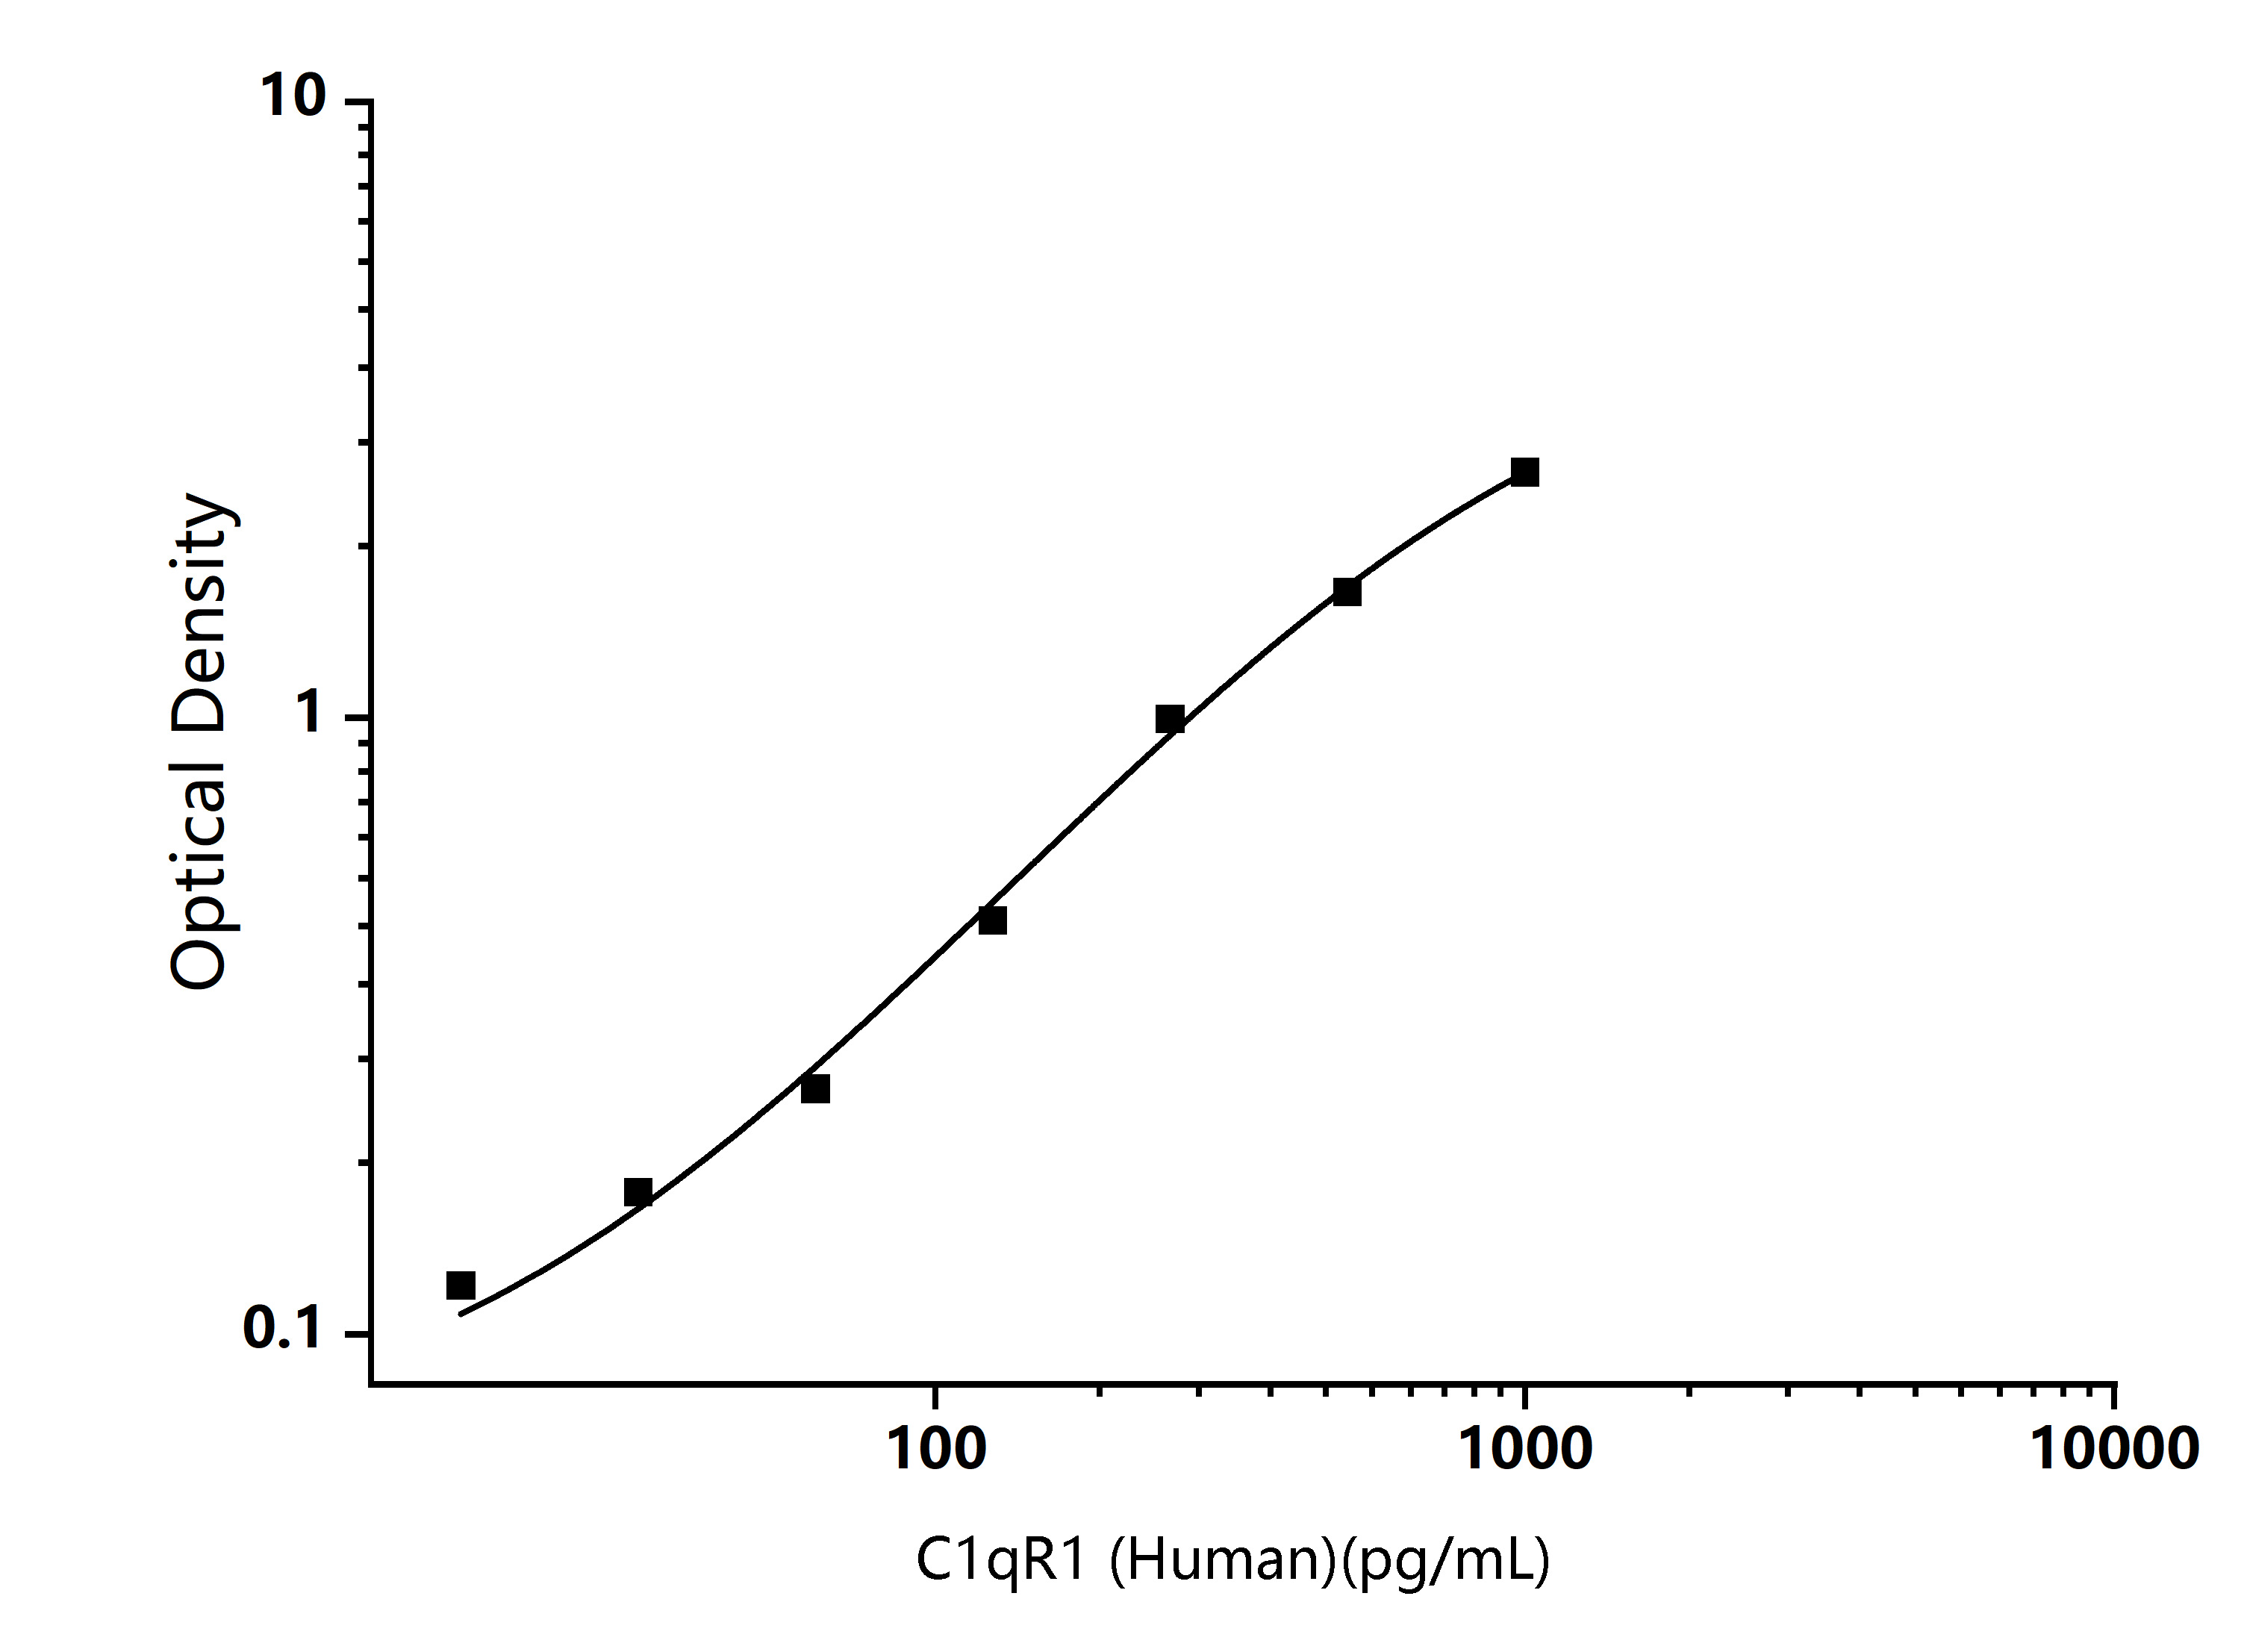
Synonym: CDw93; CD93; C1qRP; C1q-R; MXRA4; Matrix-remodeling-associated protein 4; CD93 Antigen; C1q/MBL/SPA receptor; Complement component 1 q subcomponent receptor 1. This Human C1qR1 (Complement Component 1, Q Receptor) ELISA Kit applies to the in vitro quantitative determination of Human C1qR1 concentrations in serum, plasma and other biological fluids. Type:Sandwich, Assay time:3.25h, Detection type:Colormetric, Precision:CV<10%, Assay Range:15.6-1000pg/mL, Sensitivity:6.7pg/mL, Recovery:80%-120%, Cross reactivity:The kit detected Human C1qR1 in the samples and no significant cross-species reactions were found. Detection Principle:This ELISA kit uses the Sandwich-ELISA principle. The micro ELISA plate provided in this kit has been pre-coated with an antibody specific to Human C1qR1. Standards or samples are added to the micro ELISA plate wells and combined with the specific antibody. Then a biotinylated detection antibody specific for Human C1qR1 and Avidin-Horseradish Peroxidase (HRP) conjugate are added successively to each micro plate well and incubated. Free components are washed away. The substrate solution is added to each well. Only those wells that contain Human C1qR1, biotinylated detection antibody and Avidin-HRP conjugate will appear blue in color. The enzyme-substrate reaction is terminated by the addition of stop solution and the color turns yellow. The optical density (OD) is measured spectrophotometrically at a wavelength of 450 nm ± 2 nm. The OD value is proportional to the concentration of Human C1qR1. You can calculate the concentration of Human C1qR1 in the samples by comparing the OD of the samples to the standard curve.